Geospatial AI agent by RASID
Ask Earth a question.Get the layer back.
GoPilot is RASID’s AI geospatial agent. Describe the analysis in plain language. It finds the satellite data, runs the models, and hands back GeoTIFF and GeoJSON layers you can open in QGIS.
No credit card. Runs in your browser. The no-account trial takes text prompts on the real map; uploads and drawing an area need an account.
Try GoPilot
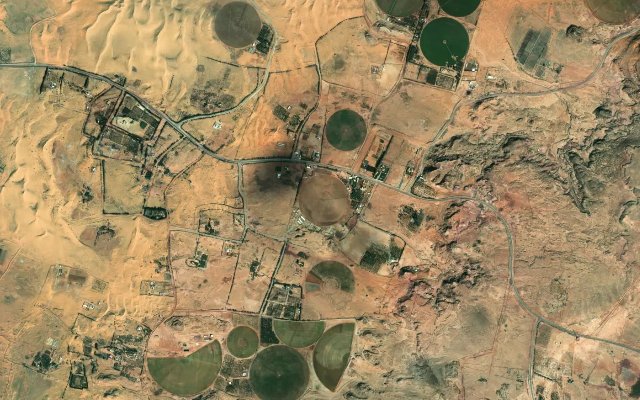
Example GoPilot conversation: delineating centre-pivot fields in Al Jawf Province, Saudi Arabia
- Analyst asked:
Can you delineate a couple of the circular fields in the Al Jouf Province KSA
- GoPilot replied:
Reasoning: I need to geocode Al Jawf Province, Saudi Arabia to establish the AOI, then pull imagery and run field delineation. Since the province is large, I should narrow in on a known agricultural zone with circular pivot fields rather than the whole region. I recall this area is famous for circular center-pivot farms irrigated from fossil aquifers, especially near Sakaka and Al Qurayyat. I'll geocode "Sakaka, Al Jawf, Saudi Arabia" instead and use a focused point with a small buffer for the AOI. There's a tool called ksa_delineate_fields specifically for KSA Sentinel-2 that might be better suited for detecting circular fields there, so I should check the catalog for it. Since this model is trained specifically for Saudi Arabia, it's the better fit. I'll use locate_point for Sakaka at lat 29.9784, lon 40.2048 with a 15km buffer to get a 30x30km bounding box, then search sentinel2_search_goserver with low cloud cover and recent growing-season dates, fetch the 12 bands L2A product, and run ksa_delineate_fields_goserver on it.
Tools used: pre_order_tools, geocode, list_tools, load_tools, catalog_tools, list_tools, locate_point, load_tools, sentinel2_search_goserver, sentinel2_fetch_goserver, ksa_delineate_fields_goserver, list_tools, load_tools, add_area_column_goserver, present_files, signal_end
Using the latest clear scene (2026-09-27, 0% cloud cover). Fetching the required 12 bands.
Delineation complete over the Sakaka agricultural belt, Al Jawf Province.
Results — Al Jawf Province (Sakaka area), Saudi Arabia
AOI: 30×30 km square centered on Sakaka (29.978°N, 40.205°E)
Source scene: Sentinel-2 L2A S2A_37RFP_20260927_1_L2A, 2026-09-27, 0% cloud cover, 10 m resolution, 12 bands
Model: ksa_delineate_fields (Mask R-CNN, trained specifically for Saudi Arabia field geometry)
Results — Al Jawf Province (Sakaka area), Saudi Arabia Metric Value Fields delineated 324 Total mapped area 2,097.9 ha (~21.0 km²) Mean field size ~6.5 ha This part of Al Jawf is a classic center-pivot irrigation zone drawing on fossil (non-renewable) groundwater from the Saq aquifer — the characteristic circular pivot fields seen from space are typical here, ranging from a few hectares up to large >20 ha pivots. The output GeoJSON holds one regularized polygon per field.
Download
Download: sakaka_fields_with_area.geojson
Result file: sakaka_fields_with_area.geojson, 275.6 KB, shown on map
- Analyst asked:
Give me the field size distribution as a CSV so I can chart it
- GoPilot replied:
Reasoning: I don't see a direct geojson-to-csv tool in the catalog, only the reverse conversion exists. inspect_file only samples 50 of 324 features, and without code execution I have no way to convert it myself. I can use filter_vector_rows_numerical repeatedly across bin ranges to build a histogram of counts per range. That gives a usable distribution for charting without needing every raw value. I'll probe thresholds at 0.5, 1, 2, 3, 5, 7, 10, 15, 20, 30, 50 and 80 ha, then difference consecutive counts to get bin sizes and verify they sum to 324.
Tools used: catalog_tools, load_tools, catalog_tools, list_tools, catalog_tools, inspect_file, present_files, load_tools, execute_tool, web_fetch_exa, catalog_tools, filter_vector_rows_numerical_goserver, filter_vector_rows_numerical_goserver, filter_vector_rows_numerical_goserver, filter_vector_rows_numerical_goserver, filter_vector_rows_numerical_goserver, filter_vector_rows_numerical_goserver, filter_vector_rows_numerical_goserver, filter_vector_rows_numerical_goserver, filter_vector_rows_numerical_goserver, filter_vector_rows_numerical_goserver, filter_vector_rows_numerical_goserver, filter_vector_rows_numerical_goserver, catalog_tools, signal_end
No vector-to-CSV conversion tool is available in the toolchain, so I built the distribution directly from the delineation output (sakaka_fields_with_area.geojson, 324 fields, area_ha column) using cumulative numeric filtering and differenced the bin edges. Here's the histogram, ready to paste into a .csv file:
bin_min_ha,bin_max_ha,field_count,pct_of_fields
0.0,0.5,103,31.8
0.5,1.0,36,11.1
1.0,2.0,27,8.3
2.0,3.0,20,6.2
3.0,5.0,33,10.2
5.0,7.0,21,6.5
7.0,10.0,23,7.1
10.0,15.0,14,4.3
15.0,20.0,20,6.2
20.0,30.0,14,4.3
30.0,50.0,9,2.8
50.0,80.0,3,0.9
80.0,inf,1,0.3
Checks: counts sum to 324 (matches total delineated fields); total mapped area 2,097.9 ha (mean ≈ 6.5 ha/field).
Read: Heavily right-skewed — ~43% of fields are under 1 ha (small plots and pivot edges clipped by the model), while a long tail of 13 fields exceed 30 ha. Classic center-pivot irrigation footprints in this part of Al Jawf typically fall in the 15–30 ha band, which holds 34 fields (~10.5%) here.
Download
Download: sakaka_fields_with_area.geojson
Credibility
Built with leading organizations.
RASID participates in the wider geospatial ecosystem through AWS, the World Bank and the OGC
Real prompts
What people actually ask it.
These six are the starter prompts GoPilot ships to new users. Each one is a single sentence, and each one is a job that used to take an afternoon.
- Urban
“Show me all the buildings within 2km of the Eiffel Tower”
Buffer in true metres, auto-UTM, then a spatial join against building footprints.
- Urban
“Scene parse the 500-meter proximity around Burj Khalifa”
Open-vocabulary scene parsing over high-resolution optical imagery.
- Vegetation
“How much greener is Central Park in July than in January”
Two Sentinel-2 scenes, cloud-masked, NDVI on both, differenced.
- Wildfire
“Apply burn scar analysis on the 2023 Maui wildfire zone”
NBR before and after, thresholded into a burn-severity raster.
- Agriculture
“Can you delineate a couple of the circular fields in the Al Jouf Province KSA”
The run playing in the hero. 324 field polygons, 2,097.9 ha, one prompt.
- Land cover
“Show me land cover classification for Lake Tahoe”
Esri annual land use and land cover at 10 m, clipped to your area.
Send one yourself, no account neededtext prompts on the real map. Uploads and drawing an area need an account.
Auditability
It shows its work. All of it.
You should not have to defend a geospatial result you cannot audit. GoPilot exposes the whole chain: what it thought, what it called, which scene it used, and what it could not do.
You can watch it think.
Every answer can open its reasoning. The Thinking panel streams the chain that produced the result while the run is still going, so if GoPilot is about to pick the wrong collection you see it before it finishes, not after you have shipped the map.
Every tool, named, with its status.
GoPilot logs each tool it calls by name, marked in progress, succeeded or failed. No silent fallbacks and no quiet substitutions.
- sentinel2_search_goserver
- sentinel2_fetch_goserver
- ksa_delineate_fields_goserver
- add_area_column_goserver
- filter_vector_rows_numerical_goserver
The provenance travels with the answer.
GoPilot names the scene it used, not just the result. Written into the answer, not buried in a log.
Sentinel-2 L2A S2A_37RFP_20260927_1_L2A, 2026-09-27, 0% cloud cover, 10 m resolution, 12 bands
It tells you when it cannot.
When a tool it needs does not exist in its toolchain, GoPilot says so in the answer and works around it in the open, rather than improvising a result that looks useful.
“No vector-to-CSV conversion tool is available in the toolchain, so I built the distribution directly from the delineation output using cumulative numeric filtering and differenced the bin edges.”
Your conversations are not training data.
Conversations may be reviewed for quality and safety, but are never used to train our AI models. Session replay and heatmaps are switched off across the product, because the screen shows your imagery, your coordinates and your project names.
Coverage
One interface over 10,000+ datasets.
GoPilot searches, filters and fuses Earth observation archives so you never open another catalogue UI. Data sources include Sentinel-2 optical imagery, high-resolution optical imagery, DEM elevation, ERA5 climate reanalysis, and foundation-model embeddings such as Clay and AlphaEarth.
Datasets and providers
AI models
- Scene parsing · open vocabulary
- Field delineation
- Solar panel segmentation
- Tree crown & palm detection
- Cloud & shadow detection
- Methane plume detection
- Banana TR4 disease detection
- Wheat crop classification
- DINOv3 embeddings + PCA
Plus spectral indices (NDVI, NDWI, NBR), multi-date change detection, phenology, band math and raster algebra, thresholding and reclassification, and the vector toolkit: buffer in true metres with auto-UTM, intersect, union, difference, dissolve, spatial join and geodesic area columns.
The agent does not replace specialised geospatial models; it orchestrates them.
Outputs come back as the file the worker produced. GoPilot can return maps, quantitative results and downloadable raster and vector layers, in formats such as GeoTIFF and GeoJSON, so results drop into standard GIS workflows.
Integrations
It does not ask you to leave QGIS.
GoPilot runs where you already work. One engine, three ways to use it: the agent in your browser, GoServers over MCP and the API, and plugins inside the GIS tools you already use.
GoPilot, inside QGIS
Install it from the QGIS Plugin Manager: open Plugins, Manage and Install Plugins, and search for GoPilot. Sign in with a key, pick a solution, define or upload your area of interest, and run AI-assisted geospatial and Earth observation processes without leaving your project.
Open the QGIS plugin pageGoPilot, docked inside ArcGIS Pro
Download the add-in, close ArcGIS Pro, double-click to install, and a RASID tab appears on the ribbon. Same solutions, same areas of interest, same results, reviewed and exported in place.
Download the add-in
GoServers: geospatial analysis as a tool call
GoPilot's geospatial capabilities are exposed over MCP through four GoServers. Fetch data, run vector operations, analyse rasters and time series, and run AI models. Orchestrated by GoPilot, or called directly from your own code.
- GoServer-FetchDiscover and retrieve from 10,000+ datasets
- GoServer-GeoVector operations on GeoJSON, GeoParquet and shapefiles
- GoServer-AnalyzeRaster processing, spectral indices, change detection and time series
- GoServer-AIRun RASID's geospatial AI models on imagery
The MCP connector for AI agents is an Enterprise plan feature.
Read about GoServersYour own tools, with your own key
Create a named API key in Settings, Developer, API Keys, with an optional expiry. The key is shown once and is revocable at any time, and each one carries its own usage analytics: total, successful and failed requests, average response time, and a log of every call.
Create an API key
Recognition
Reviewed by people who do this for a living.
I was impressed by GoPilot's detailed reasoning and its ability to autonomously adapt its workflow to complex geospatial queries. It successfully produced the requested raster and vector outputs, and its capabilities stood out compared with other geospatial AI systems I have tested.
Giulio PoggiPost-doctoral researcher, Centre for Cultural Heritage Technology (CCHT), Istituto Italiano di Tecnologia What impressed me about RASID is their ability to bring together Earth observation, geospatial technologies, and AI into practical solutions. GoPilot is a strong example of this, combining advanced AI with geospatial data and tools to simplify complex analysis. It has been exciting to see the team develop this capability and we look forward to seeing what they build next.
Miriam PuertosPartner Manager, AWS Using GoPilot gave me a different perspective on how geospatial analysis can be approached. I was particularly interested in exploring how it could be applied to different challenges across the Arab region, and I see significant potential for developing practical use cases around the needs of the region.
Dr Osama RayisChair of Agripreneurship, Arab Organization for Agricultural Development (AOAD)
Winner, AWS and thriveGEO GenAI for Geospatial Challenge 2026GoPilot launch, AWS London
Read about the challengePricing
Start free. Scale when you need to.
Every plan includes the full map workspace. What changes is how much GoPilot you get, how much you can store, and which datasets and exports are unlocked.
Free
Explore GoPilot and run your first analyses.
€0per month- Tokens
- 50,000
- Storage
- 1 GB
Includes
- Basic datasets
- Basic AI models
- Export raster and vector results
- Session history management
Pro
Most popularFor analysts running recurring geospatial work.
€149per month- Tokens
- 500,000
- Storage
- 100 GB
Everything in Free, plus
- Pro datasets
- Pro AI models
- Dashboard
- GoBox
- QGIS Plugin
- Personal license
- 1 named user
Business
For organizations scaling geospatial intelligence.
€499per month- Tokens
- 2,500,000
- Storage
- 1 TB
Everything in Pro, plus
- Premium datasets
- Premium AI models
- ArcGIS Pro Add-in
- Priority email support
- Commercial license
- 1 named user
Enterprise
For organizations with custom deployment needs.
Customtailored to your deployment- Tokens
- Custom
- Storage
- Custom
Everything in Business, plus
- MCP connector for AI agents
- Custom on-prem installation
- Custom Cloud installation
- Dedicated account manager
Tokens are used across GoPilot, GoBox, and RASID’s MCP / API services.
A turn costs what it costs. A long analysis over large rasters uses more than a one-line question, and unused tokens expire when the period resets rather than rolling over.
See the live plan page for the current list.
Questions
GoPilot, answered.
What is GoPilot?
GoPilot is RASID's AI geospatial agent. You describe the analysis you want in plain language, and GoPilot interprets the request, plans the workflow, retrieves the relevant imagery and Earth observation data, selects and runs the appropriate AI models and geospatial operations such as segmentation, detection and change analysis, then returns the results as downloadable raster and vector layers alongside the numbers that matter. One platform, 10,000+ datasets, hundreds of AI models, one natural-language interface.
Is GoPilot real GIS, or an AI chat wrapper on a basemap?
Real GIS. The map is a live Mapbox canvas, not a picture, and the agent adds and removes layers on it while it works. The operations it calls are the ones you would run by hand: catalogue search across Sentinel-2 and Landsat, cloud and shadow masking, spectral indices, segmentation, change detection, geodesic area columns, spatial joins. Every output is a georeferenced file with a CRS, not a screenshot. What GoPilot removes is the catalogue hunting, the reprojection and the parameter fiddling in front of the analysis, not the analysis itself.
How is this different from just using QGIS or ArcGIS Pro?
It is not better than them. Desktop GIS is more powerful and more precise, and GoPilot exports into it on purpose. The difference is everything in front of the analysis: finding a clear scene, masking cloud, aligning projections, writing the same index expression again. GoPilot does that part while you watch and hands you the layer. There is a GoPilot plugin for QGIS and an add-in for ArcGIS Pro, so results come back into the tool you already work in.
What happens when GoPilot gets the analysis wrong?
You see it before it finishes. The reasoning panel and the tool list stream while the run is in progress, each tool marked in progress, succeeded or failed, so a wrong collection or a failed step is visible as it happens rather than after you have shipped the map. GoPilot also tells you when it cannot do something: when a tool it needs does not exist in its toolchain it says so in the answer instead of improvising. And because every result is a standard georeferenced file, you can open it in QGIS or ArcGIS Pro and check the numbers against your own data.
Can I use GoPilot inside QGIS or ArcGIS Pro?
Yes. The GoPilot plugin is published on the official QGIS plugin repository: open Plugins, Manage and Install Plugins, and search for GoPilot. For ArcGIS Pro, download the add-in and a RASID tab appears on the ribbon. Both authenticate with an API key you create yourself in Settings, Developer, API Keys. On the published plans the QGIS plugin is included from Pro at EUR 149 per month and the ArcGIS Pro add-in from Business at EUR 499 per month.
Is GoPilot free, and what is a token?
Yes, there is a free plan: EUR 0 per month with 50,000 tokens, basic datasets and models, raster and vector export, session history and 1 GB of storage, and no credit card. Tokens pay for GoPilot's work. A turn costs what it costs, so a long analysis over large rasters uses more than a one-line question, and unused tokens expire when the period resets rather than rolling over. Tokens are used across GoPilot, GoBox, and RASID's MCP / API services. The paid plans are Pro at EUR 149 per month with 500,000 tokens, Business at EUR 499 per month with 2,500,000 tokens, and Enterprise with custom pricing.
GoPilot is the interface to Earth.
Sign up, draw an area, and ask. 50,000 tokens, no credit card.